
In a story half history and half legend, Sir Francis Bacon, the father of empiricism, met a strange end. To settle a heated dispute with the King’s physician over preserving meat in cold weather, they decided to conduct a controlled experiment. On a frosty day in Highgate, they diligently dug a hole and buried a piece of meat. Tragically this scientific experiment cost the 65-year-old Bacon his life. He contracted pneumonia and passed away just a few days later, becoming another science martyr for his unshakable belief in empirical evidence. (As a side note, the first scientist to systemically use controlled experiments, in chemistry, was in fact Jabir ibn Hayyan, dating back to 721-815.)
Controlled experiments are fundamental to scientific research. But in the business world, perfect A/B tests are rare. Costs considerations, effects on customer experience, interactions between subsystems, the legacy architecture, and codebase, and the lack of statistical proof are some of the frequently occurring issues. Although quick and accurate experiments can lead to many new ideas and improve a company’s performance, continuous struggles with running experiments are common, except for a few large tech companies.
In this article, we’ll look at the life cycle of controlled experiments, the causes of imperfection in our experiments, and a few techniques to use in imperfect settings. Moreover, we discuss tricks and techniques we can use in different stages of the experiment life cycle.
Roots of Imperfection
A/B tests received substantial attention with the rise of the web. With millions of users visiting your product daily, it’s straightforward to present a variation and measure the impact of changes. A few crucial factors are
- the enormous quantity of observations (millions of customers),
- the relatively short timeframe needed to collect statistically significant data,
- the low cost of initiating a new experiment (a UI color change can be made in minutes), and
- minimal side-effect costs: unlike testing a new medicine, the cost of a poor variation is a few lost sales.
This led to ultra-optimized, large-scale tech giants popularizing the experimentation framework. However, other companies often overlook the context and prerequisites, especially those in different industries. Let’s examine the life cycle of controlled experiments (A/B tests) and the sources of imperfection at each step.
Life Cycle of A/B Tests
Controlled experiments can be conducted to scrutinize any vital assumption (hypothesis) regarding:
- the product and its variants,
- branding and promotional messaging,
- assumptions about customer segments, and
- the behavior of different customer segments.
However, without adhering to strict procedures for designing, executing, and learning from experiments, misusing them and drawing incorrect conclusions is easy. Examining the life cycle of an experiment can aid us in avoiding common pitfalls.
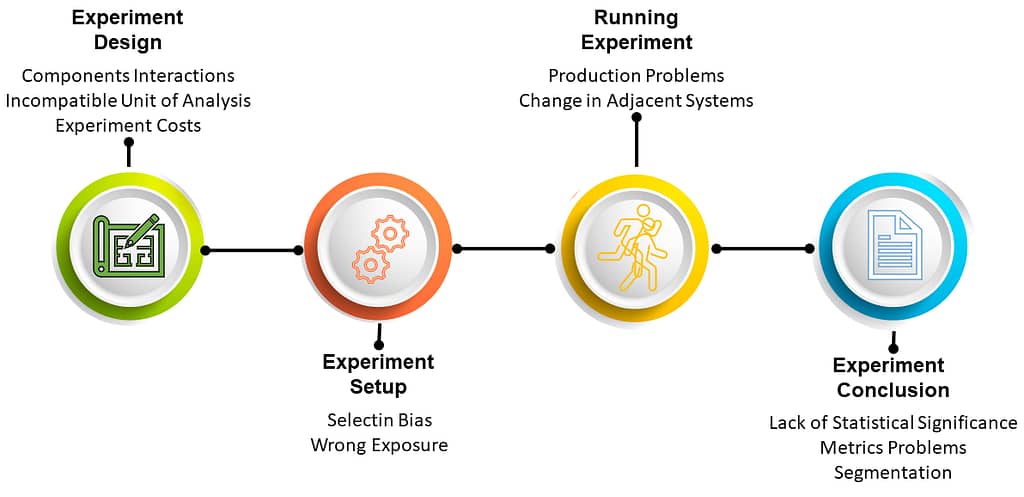
Experiment Design
Any experiment must be thoughtfully designed to prevent failure. Essential aspects of the design include:
- Unit of analysis: What is the aggregation unit that informs our decisions? In some cases, the unit of analysis is the customer, which is straightforward.
- However, it can sometimes be unclear. For instance, when we have multiple accounts with the same customer, should the unit be individual accounts or the customer? Or should it be the household or individual household members? Addressing these questions determines the experiment’s concept, the necessary number of observations, and the anticipated scale.
- Binning strategy: This involves dividing the objects into control and various treatment groups. We will discuss how this strategy can potentially lead to data contamination.
- Experiment costs: Running an experiment itself comes with certain costs, which should be balanced against the expected benefits. It’s essential to estimate and size these during the design phase.
- Success criteria and guardrails: Despite perfectly executed experiments, it’s not uncommon for individuals to cherry-pick favorable metrics after the fact to declare success. This can lead to issues like the “multiple comparisons problem” and “p-hacking,” which should be avoided.
The solution to this problem is straightforward: establish a single metric as the success criteria and two to three metrics as the guardrail metrics. Acceptance of the hypothesis will depend on whether the primary metric improves and the guardrail metrics do not statistically worsen. A few segments can be pre-designed for segmentation studies, and the difference is measured based on this design.
Several crucial issues can lead to imperfections in experiment design, including:
- Interaction between different systems: Isolating the system under study is essential to ensure only one effect’s change is measured. However, in production settings, studying one effect separately from others can be challenging. For instance, lowering a product’s price might impact the sales of another product within the company’s portfolio.
- Incompatible unit of analysis: If the data for the targeted unit of analysis doesn’t exist or is difficult to gather, it results in an imperfect experiment. For example, in payment systems, several accounts may belong to one person, but experimenting with each individual might prove hard.
We will discuss a few techniques to address these problems next.
Experiment Setup
The next step is setting up the experiment in the system and preparing to run it. This could involve adding cookies or tracking labels in the system’s backend for web-based or mobile apps. From the earliest data flow, we can track the correct number of instances allocated to each bin using Chi-square tests. Additionally, we need to verify if the treatments receive the designed treatment accurately and whether there are any signs of double exposures.
Various types of issues can arise during an experiment setup:
- Selection bias: During design and setup, we might introduce a systematic bias to one or more groups. For instance, individuals who fail (or succeed) might be removed from the experiment (survivorship bias), the sampling frequency may not represent all possibilities, and bias could be introduced by data collection (like the lack of cookies on mobile phones). Regrettably, we typically can’t correct selection bias once data is collected.
- Wrong exposure: During setup, subjects in the control group might be exposed to treatment inadvertently. For example, some legacy systems might not adhere to the correct experiment design in complex multi-channel web systems. A more subtle exposure issue is related to timing; some subjects might be exposed at different times, where the temporal distribution of arrivals is a confounding factor. As long as these effects can be ignored, or the incorrect exposures are not systematic, we may be able to clean up these effects post-experiment.
Running the Experiment
In his 1945 paper, “Sequential Tests of Statistical Hypotheses,” Wald outlines a method for continually running a test until the requisite statistical significance is achieved. Whether we utilize a predefined time-based criterion to halt the experiment or apply sequential testing, monitoring the experiment closely is crucial to ensure no data contamination occurs.
The experimenters can’t take their hands off the driving wheel while running the experiment. A sudden shutdown of service in the production system could skew the experiment results. Similarly, an issue in a neighboring system could distort the flow of samples to different treatments, among other potential problems. Close observation of the experiment and subsequent removal of contaminated data could prove beneficial if such issues arise.
Experiment Conclusion
The final step involves utilizing the experiment results to accept or reject the hypothesis. Ideally, at this point, we have already set a clear set of hypotheses, a single success criterion, and a range of guardrail metrics. However, several common issues can occur at this stage:
- Lack of statistical significance: Often, we are interested in measuring relatively rare events: out of millions visiting a website, only a small number might make a purchase. Even with meticulous planning, finding sufficient statistical significance for this calculation can sometimes be challenging.
A handy technique in such cases is to use correlated metrics with larger values as the success metric and the smaller ones as guardrails. For instance, we can select the number of people clicking on a link and visiting a website (Click-Through Rate or CTR) as our success metric and final sales as our guardrail. In this scenario, we can declare success if there is a statistically significant increase in CTR while sales are higher but not yet statistically significant. - Metrics problems: There are conflicting perspectives on defining metrics for experiments. While having a ‘North Star’ – a singular, all-encompassing metric – was pivotal to Facebook’s success, breaking down compound metrics can reduce variance and provide better insights into relationships. For instance, total sales equate to the number of people who made a purchase multiplied by the average order size. In experiments to boost sales, we can use sales rate (or conversion rate) as the success metric and the average price as a guardrail, and vice versa. This approach also offers the benefit of lowering variance and requiring fewer observations.
- Segmentation: Every experiment offers the opportunity to segment subjects into distinct groups and measure the impact of changes on each. However, excessive manipulation of data can lead to an abundance of hypotheses. Within various segmentation schemes, we may discover sporadic relationships. To circumvent this issue, we better define a few segments we will analyze and measure for statistical significance in advance. Following this method, we may only further subdivide segments for insights if the overarching level shows a statistically significant impact in the same direction.
Non-standard Arrangements in Testing
In this section, I outline a few methods that fall short of true controlled experiments but can provide directionally valuable insights. Please exercise caution with these approaches and strive to uphold the rigor of controlled experiments within your organization. Use these methods sparingly, and they can contribute to a robust toolset for gaining insights to inform data-driven decisions.
Before After Analysis
One method of gauging the impact of a treatment involves measuring a metric on the population before and after its application. For instance, let’s take the claim by a government that enforcing seat belt use has reduced car accident fatalities by 35%. To analyze such a claim, one would measure the annual number of deaths in car accidents in a certain region and compare it with the previous year’s figures.
While this method can be useful for certain estimates, it does invite a host of potential problems:
- Survivorship bias: Consider the question, “What is the ratio of publicly traded bank failures in the five years after the introduction of the Dodd-Frank law compared to the five years prior?”
- One stumbling block here is whether or not you count the banks that failed in the first five years when you measure the next five years. Likely not, but keep in mind that the banks in the second set survived the first period, implying that they were inherently more robust.
- Moreover, the average age of the banks in the second set is higher by five years.
- Seasonality and temporal effects: Besides changes in age, numerous metrics are naturally subject to seasonal fluctuations. Website visits tend to spike on weekends, sales increase during the holiday season, and so forth. Should you adjust for these shifts?
- Confounding variables: Moreover, consider the effects of environmental changes. For instance, when analyzing the banking system, did events like the Iraq War or the aftermath of the 9/11 attacks have a significant impact?”
These examples underscore some of the constraints of before-and-after analysis. However, if you deal with significantly large effects and make cautious adjustments for environmental and seasonal factors, you might obtain a directionally correct estimate.
Inaccurate Units of Analysis
How can we rectify the problem in the unit of analysis? This issue can be quite serious: envision a scenario where the same person is exposed to two different variables just because they’re using a mobile device versus a web app or for two different accounts. This situation not only skews our experiment results but also delivers a horrible user experience.
While there are statistical methods to employ, such as hierarchical linear models, we often find ourselves out of luck regarding data. A crucial step is to evaluate the extent and severity of bias that an incorrect unit of analysis could introduce. Moreover, it’s important to remain vigilant about two common fallacies caused by utilizing the wrong unit of analysis:
- Ecological Fallacy: This involves making assumptions about individuals from group data. For example, noticing a correlation between lower income levels and higher crime rates might lead us to infer that each person with a lower income is more likely to commit a crime, which overlooks substantial individual differences.
- Atomistic Fallacy: It involves making incorrect assumptions about groups based on individual characteristics while disregarding other significant attributes. For instance, we might know that older people tend to support conservative political views. Using this information, we could mistakenly presume that regions with a higher average age are more conservative while neglecting other crucial factors like socioeconomic status, education, etc.
Statistical Adjustments
While not necessarily related to imperfect experiments, several useful statistical techniques can be employed in certain scenarios. For instance:
- Multiple regression: This is a commonly used technique and can be utilized to determine the impact of various covariates on the desired outcome of the analysis.
- Crossover design: In this design, the same groups alternate between serving as the control and receiving the treatment at different times. This method can help decrease variance caused by individual differences.
- Stratification: If we suspect certain variables might impact the outcome or aim to segment them further, we can select samples from each treatment and control group to ensure these variables are balanced across all groups.
Final Thoughts
Controlled experimentation, or A/B testing, is a potent methodology that fosters substantial organizational innovation. However, in industrial contexts, designing controlled experiments can be challenging. This often results in imperfect A/B tests where some assumptions of controlled experiments are not met.
A few causes of these imperfections are interactions between different systems, legacy architecture, an insufficient number of objects to attain the required statistical significance, lack of accessible data for the appropriate unit of analysis, and errors in the setup and analysis of the experiment. These issues can all contribute to imperfect experiments.
Mistakes can occur at every stage of the experiment’s life cycle. Careful estimation of the expected measures and potential imperfections during the design phase can help us to devise more robust experiments. The setup phase is crucial for avoiding common errors like selection bias and exposure. By closely monitoring the execution phase, we can detect errors and eliminate contaminated data. Applying advanced statistical adjustments during the final phase can yield better insights and strengthen the overall experiment.
Lastly, we covered several techniques for statistical adjustments, including regression analysis, crossover design, stratification, and multi-hierarchical modeling. We also discussed the challenges and potential benefits of standard analytical methods, like before-and-after analysis and employing different units of analysis.
Be First to Comment